The Walk-Back Tax: Saving 15 Minutes on Every Inspection
By GarageInsight Team · · 5 min read
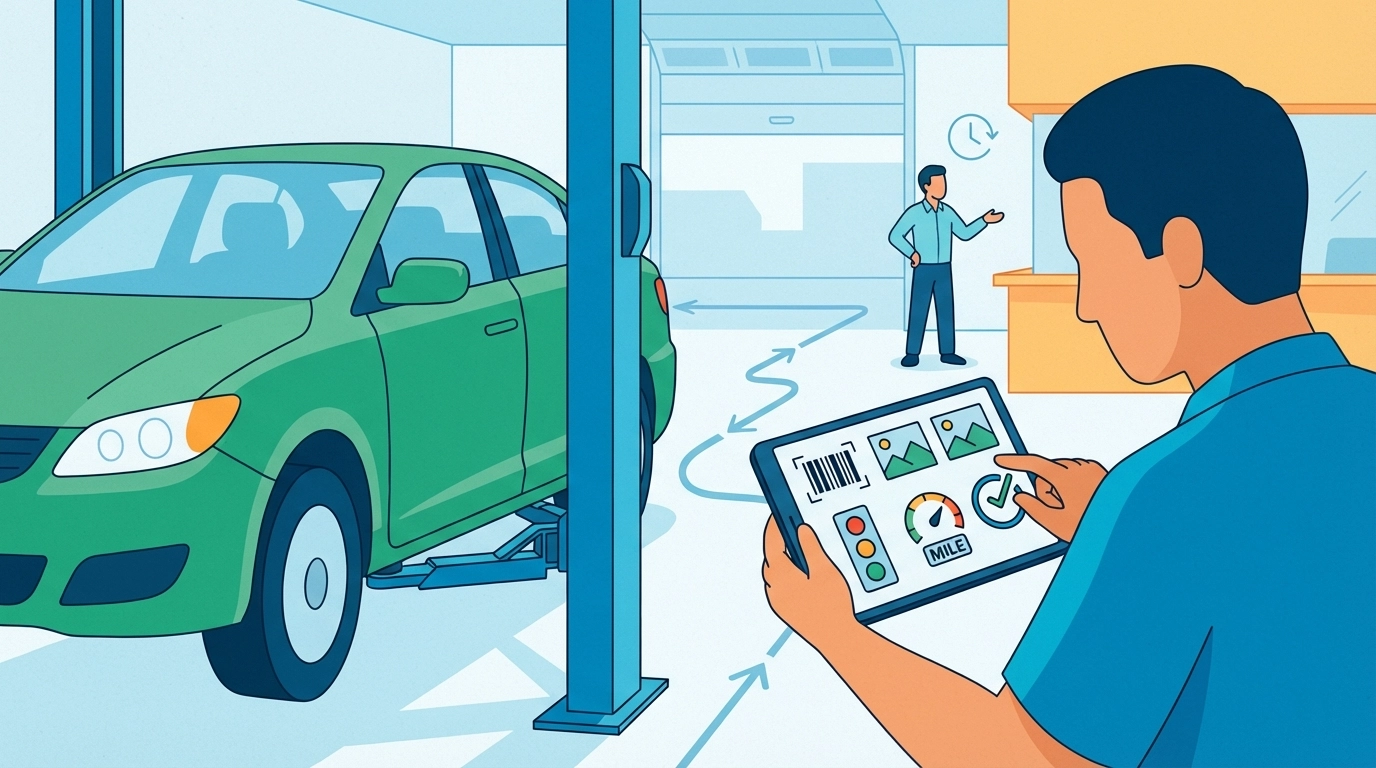
Every walk-back to the service counter costs you 15 minutes.
You know the drill. You're under a hood, find something that needs attention, but now you need clarification from the front desk. Customer authorization? Part availability? Warranty coverage?
Walk back. Wait. Explain. Walk back again.
That's the Walk-Back Tax: and it's killing your bay efficiency.
The Real Cost of Round Trips
Industry data shows the average tech makes 3.2 walk-backs per complex inspection. At 5 minutes each way (including wait time at the counter), that's 32 minutes of dead time per job.
Here's the math:
- Average inspection: 45 minutes
- Walk-back time: 32 minutes
- Actual inspection time: 13 minutes
You're spending more time walking than wrenching.

The common triggers:
- Unclear work authorization scope
- Missing customer contact info
- Part cross-reference questions
- Warranty claim verification
- Photo requirements not specified upfront
Each trip to the counter breaks your flow. Each interruption costs momentum. Each explanation takes longer than it should.
Why Walk-Backs Happen
Poor data capture at intake.
Most shops still run on paper ROs with half the boxes empty. Service writers rush through customer conversations. Critical details get lost between the counter and the bay.
The information gaps:
- Customer priorities ("Fix anything under $200 without calling")
- Previous work history (What was done last month?)
- Known issues (Customer mentioned grinding noise)
- Access limitations (Locked glove box, security system)
- Contact preferences (Text vs. call for approvals)
Without structured data capture, you're flying blind.
The Structured Data Solution
Capture everything once. At the vehicle.
Modern DVI systems eliminate walk-backs by frontloading all critical information into the inspection workflow. No more guessing. No more assumptions. No more trips.
The complete capture includes:
- Customer authorization levels (pre-approved amounts)
- Contact preferences (SMS, email, voice)
- Vehicle history (previous repairs, open recalls)
- Known concerns (customer-reported symptoms)
- Access codes (radio, security system)

Everything you need lives in your tablet. The customer's story. The vehicle's history. The authorization scope. All there when you need it.
The 15-Minute Recovery
Structured data capture saves 15+ minutes per inspection. Here's the breakdown:
Traditional workflow:
- Start inspection (5 min)
- Find issue, walk to counter (5 min)
- Explain situation, get clarification (8 min)
- Walk back to bay (3 min)
- Document finding (4 min)
- Find second issue, repeat process (16 min)
- Complete inspection (9 min)
Total time: 50 minutes
Structured workflow:
- Review pre-loaded customer info (2 min)
- Complete inspection with context (28 min)
- Document all findings once (5 min)
Total time: 35 minutes
That's 15 minutes back in your pocket. Per job. Per day.
Implementation: The Bay-First Approach
Week 6 covered mobile-first workflows. Week 14 showed standardization benefits. Week 22 will dive into advanced data architecture. This is where it all connects.
The setup:
- Tablet preloaded with customer data at vehicle arrival
- VIN scan pulls complete history and specifications
- Authorization matrix clearly defines approval levels
- Contact integration enables real-time customer communication
- Photo workflows standardized for consistency
No more "I'll have to check with the front desk."

Everything flows from structured intake:
- Customer says "check the brakes" → System flags previous brake work and warranty status
- Authorization shows "$500 pre-approved" → You know your working budget
- Contact preference shows "text for anything over $200" → Direct line to customer
- VIN decode reveals open TSBs → Additional inspection points automatically added
The Efficiency Multiplier
One structured inspection generates multiple revenue opportunities.
When you eliminate walk-backs, you create space for value-add activities:
Time recovered can be invested in:
- Deeper inspections (finding additional issues)
- Better documentation (photos that actually sell)
- Proactive maintenance identification (building customer trust)
- Real-time customer communication (faster approvals)
The compound effect: Better inspections → Higher approval rates → Increased revenue → Happier customers
Common Implementation Mistakes
Don't just digitize paper processes. That's not structured data capture: that's digital paper pushing.
Avoid these traps:
- Using DVI as a reporting tool only
- Skipping the intake optimization step
- Maintaining separate communication channels
- Ignoring historical vehicle data
- Under-training on authorization workflows
The goal isn't to replace walk-backs with tablet taps. It's to eliminate the need for clarification entirely.

Measuring Walk-Back Reduction
Track these metrics:
Before implementation:
- Average inspection time
- Walk-backs per job
- Customer approval delays
- Rework due to miscommunication
After structured data:
- Reduced inspection cycle time
- Zero-clarification jobs percentage
- Same-visit approval rates
- Customer satisfaction scores
Industry benchmark: Top-performing shops average 0.8 walk-backs per inspection. Most shops run 3.2+.
The ROI Reality
15 minutes per inspection adds up fast.
For a 3-bay shop doing 25 inspections weekly:
- 375 minutes saved per week
- 6.25 hours recovered weekly
- 325 hours annually
- At $75/hour shop rate: $24,375 additional capacity
That's nearly $25K in recovered productivity. From eliminating walk-backs.
But the real value isn't just time saved: it's flow maintained. When techs stay in the bay, they stay in rhythm. Quality improves. Stress decreases. Turnover drops.
Next Steps: Building Your Walk-Back-Free Zone
Start with intake optimization. Everything downstream depends on data captured upfront.
Week one: Audit your current walk-back frequency
Week two: Implement structured intake forms
Week three: Deploy tablet-based inspections
Week four: Measure and refine
The Walk-Back Tax is optional. Most shops pay it because they've never calculated the cost.
Calculate yours. Then eliminate it.
Your bay efficiency depends on keeping techs where they belong: under the hood, not walking the halls.
Ready to eliminate walk-backs? Our digital inspection platform includes structured data capture, real-time customer communication, and complete vehicle history integration.
Limited spots available for Q1 implementation. Apply here.